Introduction to Playbooks Reports
How to Access Insightful In-App Reporting
Within the Playbooks Manager App, managers and Playbooks administrators have exclusive access to the Playbooks Reports tab. Reports can be generated isolating the Playbooks activities a team or individual has completed and which Plays and Play Steps generate the most success. This In-App reporting option draws data directly from the XANT Playbooks platform, not the CRM, removing barriers to data that some CRMs present. It should be noted that emails sent with the Track and Sync Plugin are not sent through Playbooks but rather a customer’s email server and will therefore not be included in these reports.
Playbooks Reports Main Screen
When you first log in to Playbooks Reports from the Playbooks Manager app, you see the reports main screen. This screen contains boxes which house the report data and a brush bar for changing the report range.
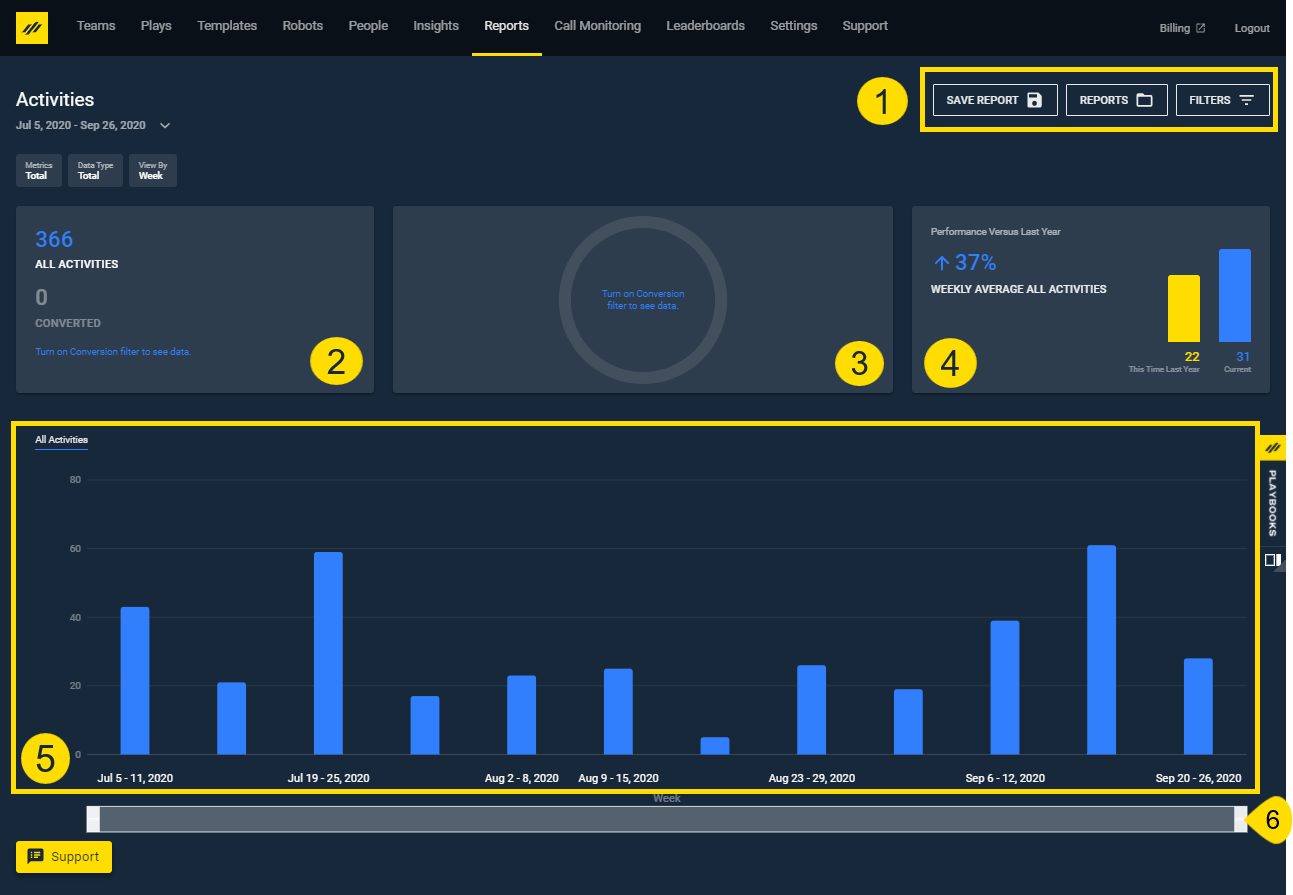
- The save button saves whatever report you have selected at the moment. The report button displays all the saved reports. The filter button opens the menu to select what metrics and data are displayed in the report.
- Displays total activities vs. total conversions of all data in the selected time period. The Conversion Metric must be turned on for the Converted field to be populated.
- Shows the conversion percentage from all the selected data against the conversion compared to the same information from the same time period in the previous year.
- Shows the total from all the data in the selected time period compared to the total from all the data from the same time period in the previous year. It highlights the rate of change between the two periods.
- Shows the data from all the filters selected. Hover over the data points to view a window with a break down of the data.
- Allows you to scale the chart to see a specific time frame in the report by moving the range selectors on the brush bar. If you have created a report with data from an entire year, you can zoom in to see more details an a few specific months using the brush bar.
Filters
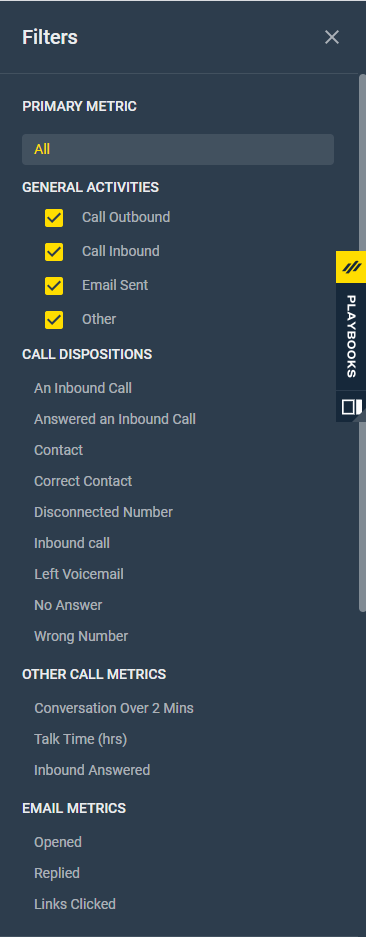
The Filters is where admins and managers go to create their reports. Clicking Filters in the top right corner opens the menu with all the options for building a report. There are many sections to the Playbooks Reports Filters which are detailed in the following sections.
Primary Metrics
Select the activity or activities featured in the report by identifying the primary metric(s). The default report metric shows all total activities for inbound calls, outbound calls, emails sent, and other tasks. Select or deselect the metrics to show specific call dispositions, other call metrics, or email metrics.
To Set Report Metrics
- Click FILTERS.
- Select the Primary Metric for the report.
- Wait for the report to refresh.
Conversion Metrics
Conversion Metrics add more analysis to your reports. The Conversion option allows for a secondary metric to overlay the chosen primary metric. This compares the primary activity metric against a secondary metric to see how effective those activities were in generating results. For example, you might choose All Activities as the primary metric and Plays Marked Successful as the Conversion Metric to see how well activities converted into successful Plays. You also might choose the primary metric Emails Sent and the Conversion Metric Emails Opened to see how often emails are opened. If you don’t want any conversion metrics, simply select the No Conversion option.
To Set Conversion Metrics
- Click FILTERS.
- Scroll down to Conversion.
- Toggle the Conversion switch to active.
- Select the secondary metric from the now visible Conversion menu.
- Wait for the report to refresh.
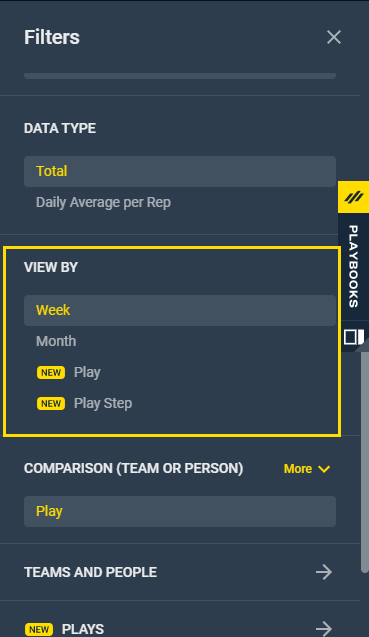
Data Type
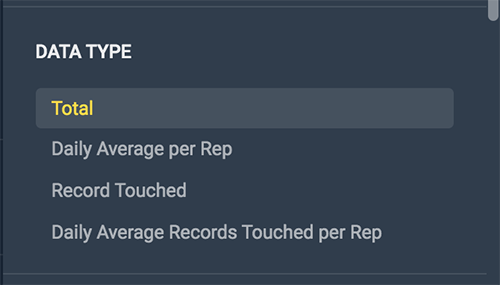
Data Type specifies how the metrics are counted. The report displays the metrics by either the total number of activities, the daily average per rep, the number of unique record touches, or the daily average of records touched by rep. Daily average per rep only includes reps who were active in the selected time period. Active reps are defined as reps who have completed at least one activity in that time frame. Therefore, when reps are out of the office, they’re not included in the daily average calculations because they did not complete activities.
Record Touched shows how may different records were interacted with within the timeframe and chosen filters. This data helps determine Play Success, how successful your reps were based on enrolled records, or what percentage of records had meaningful conversations.
To Set Data Type
- Click FILTERS.
- Scroll down to Data Type.
- Select Total or Daily Average per Rep.
- Wait for the report to refresh.
View By
View By selects how data is presented on the Y axis. Select between Week, Month, Play or Play Step. The time frame views will show all Playbooks activities by either week or month until you add more filters. Or choose to view activities by Plays or Play Steps. Selecting these views will show all the Plays or Play Steps that have been completed by your organization, so be sure to add additional Play and people filters to narrow the amount of data presented.
To Select View By
- Click FILTERS.
- Scroll down to View By.
- Select Week or Month.
- Wait for the report to refresh.
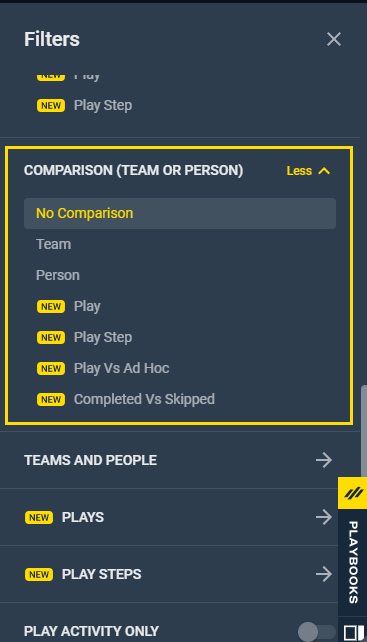
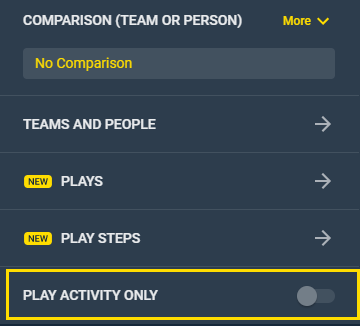
Comparison (Team or Person)
Compare the activities of multiple teams or people in a single report. The Comparison option allows you to view the metrics broken down by team, person, Play, Play Step, Play Vs Ad Hoc, or Completed Vs Skipped. If you select TEAM, any teams you have selected will be compared against each other as a whole entity. If you select PERSON, you can select an entire team and compare all the people in that team against each other or grab individual people from multiple teams.
To Set Comparison (Team or Person)
- Click FILTERS.
- Select the Team or People you want to compare.
- Scroll down to Comparison (Team or Person).
- Click More drop-down menu.
- Select the type of metrics you want to compare.
- Select the metrics you want to compare.
- Wait for the report to refresh.
Teams and People
Each report pulls activities from specific teams or people. There isn’t a limit to the number of teams or people you can include in a report, but the report will only show ten teams or people at a time. To see the remaining teams and people, click the navigation arrows above the report. People who have left the organization will still be listed as a part of the team they were in before they left and can still be included in reports. Playbooks retains the activity data from these people and will include their actions in the report when these users are selected. You can exclude these people from the report by manually unchecking their name if you select the team or not checking their name if you are adding people individually. The metrics for all the selected teams and people will be combined unless the Comparison option is turned on. For more information on comparing teams and people, view the Comparison (Teams and People) section of this article.
To Select Teams and People
- Click FILTERS.
- Scroll down to Teams and People.
- Select the Drop-down menu.
- Select the Team by selecting the check box next to the team name.
-OR-
Select the drop-down menu for each team and select the check box next to the specific person or people. - Wait for the report to refresh.
Plays
Filter your report to show the activities occurring in each Play. You can filter down to one or multiple specific Plays to understand how specific activities are performing within the Play. This report is most useful when you add conversions to see which Plays are more successful at converting leads.
Managers and Ops teams can A/B test Play effectiveness with this report filtering.
To Select Plays
- Click FILTERS.
- Scroll down to Plays.
- Select the Drop-down menu.
- Select the Play(s) by selecting the check box next to the Play(s) name.
- Wait for report to refresh.
Play Steps
Filter By Play Step to see how a Play is performing throughout each Play Step. Using the Play Step view will group all Plays together unless you select a specific Play in the Play Filter. You can also filter by specific Play Steps if you only want to see certain steps within each Play. If you filter by a specific Play, the Play Steps in that report should only show the number of steps that are in that Play. This report is most useful when you add conversions to it to see where in the Plays leads are converting.
To Select Play Steps
- Click FILTERS.
- Scroll down to Play Steps.
- Select the Drop-down menu.
- Select the Play Step(s) by selecting the check box next to the Play Step(s) number.
- Wait for the report to refresh.
View Play Activity Only
Play Activity Only switch filters out ad hoc activities from any report. Clicking this switch will only show activities completed in the Play, it will not show any ad hoc activities.
Experimenting with Reports
Once the filters for the report have been decided, try different configurations to see what other reports you can create. Watch the report details on the main page change as you adjust the filters.
Viewing Historical Data
Playbooks Reports allows you to display Historical Data up to a year old for any report.

To View Historical Data
- Create the report by setting the report Filters.
- Select the Date Drop-down menu.
- Choose a date range from the list.
-OR-
Create a custom date range from the calendar.
NOTE: Custom date ranges can only be established in weekly increments. - Click DONE.
Saving Reports
Once the desired filters and metrics have been set, the report can be saved for later use.
To Save a Report
- Click FILTERS.
- Select the primary metrics.
- Select Conversion.
- Select the Data Type.
- Select View By.
- Select Comparison (Teams and Person).
- Select Teams and People.
- Select Plays.
- Select Play Steps.
- Select Play Activity Only.
- Wait for the report to refresh.
- Click SAVE REPORT.
- Enter Report Name.
- Click SAVE.
Saved reports can be recalled later with a single click from the Reports menu.
To Recall a Saved Report
- Click REPORTS.
- Select the desired report.
- Wait for the report to refresh.
Deleting Reports
If too many reports have been saved or a report was saved by mistake, the saved reports can be deleted.
To Delete a Saved Report
- Click REPORTS.
- Select the X next to the report.
- Click DELETE on the pop-up screen.
- Wait for the report to refresh.